Bring finance, operations, marketing, and program information into a view people can use. We combine research and analytics with metric definitions, source reconciliation, and the everyday work of making reports dependable.
For finance, operations, marketing, and program leaders.
Talk through your project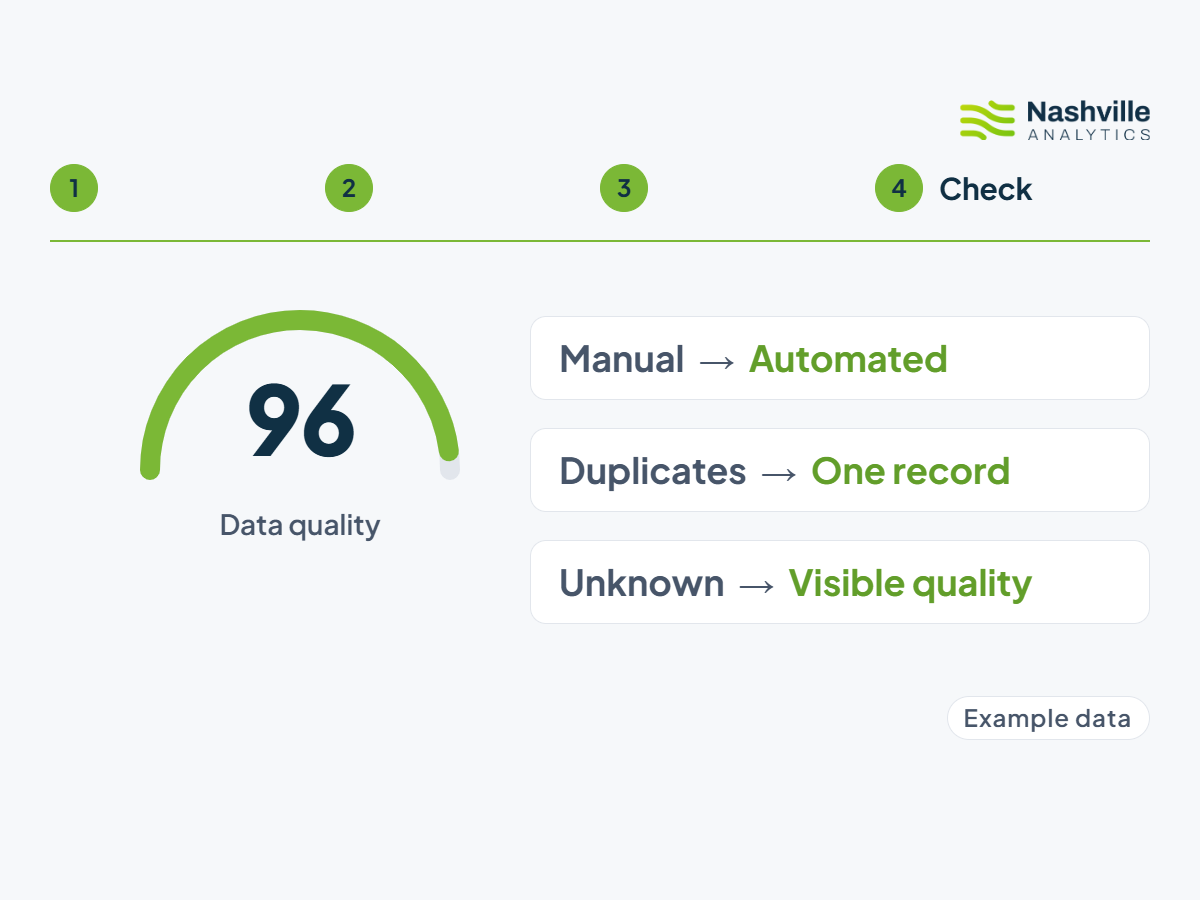
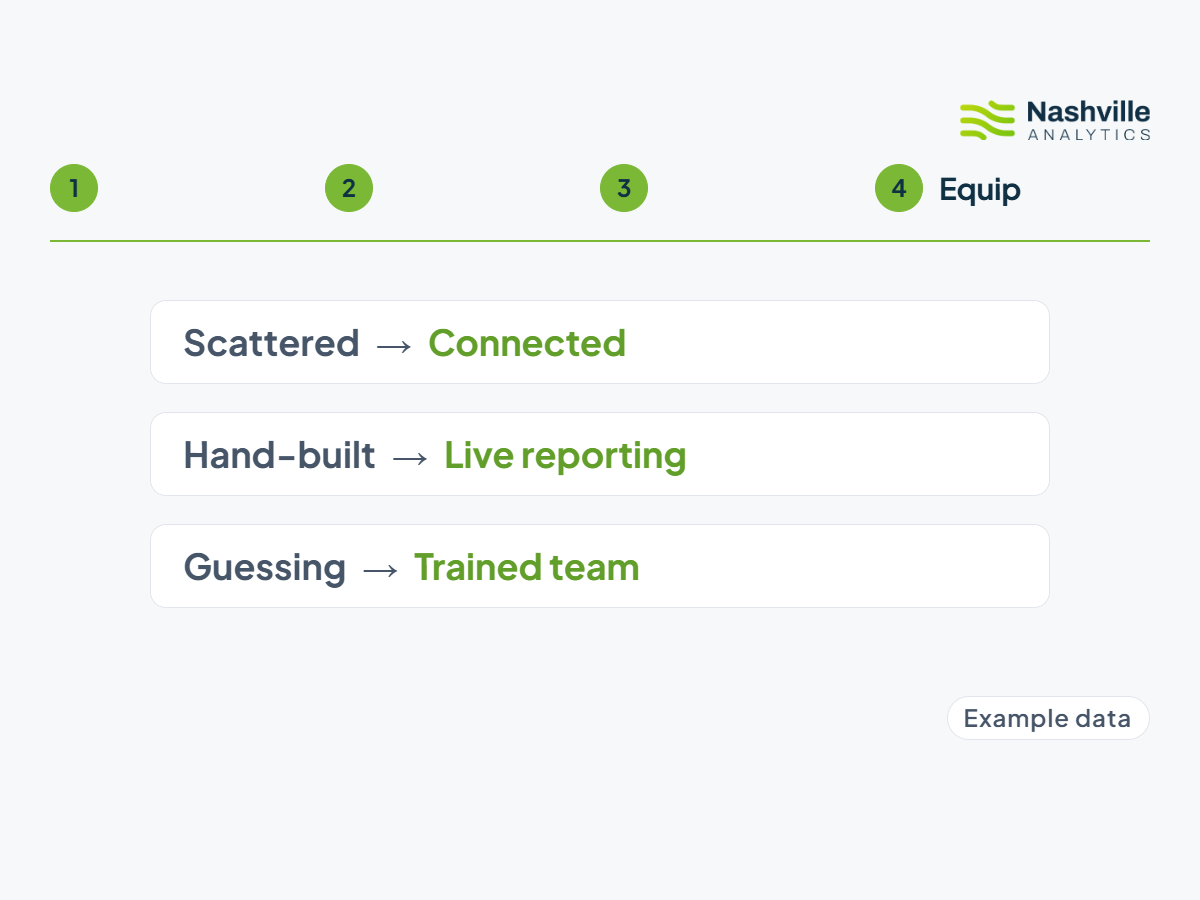
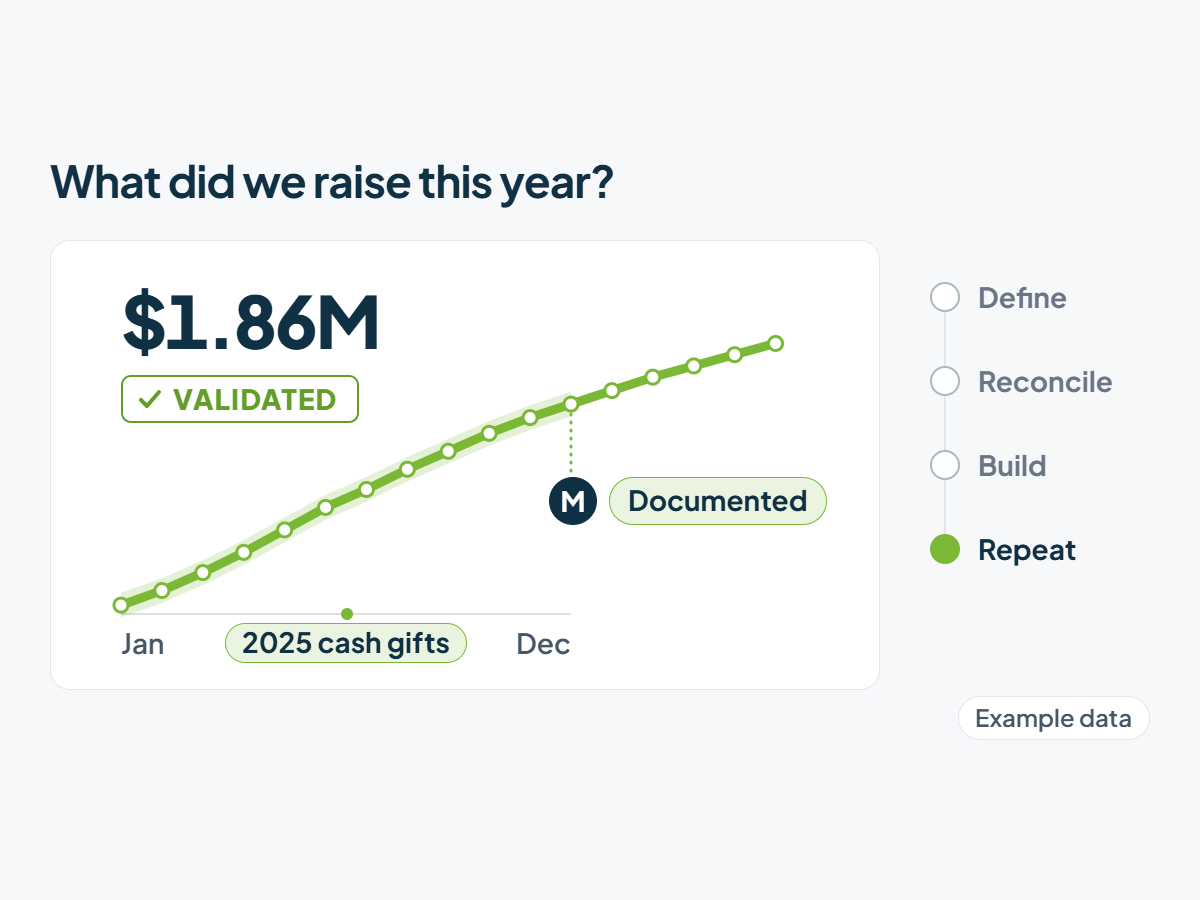
We agree on the decision, the audience, and the metrics first, then define each calculation and reconcile your sources, so everyone reads the same number for the same question.
We build reports and Power BI dashboards on reconciled sources, validate them with the people who use them, and document the process, so each reporting cycle repeats without rebuilding it by hand.
We combine research and analytics to examine the evidence and say what the available data can and cannot support. We capture the method with documentation and clear ownership, so the knowledge stays with your team.
Agree on the decision, audience, metrics, and level of detail.
Map sources, define calculations, examine quality, and identify what the available data can support.
Develop reports, Power BI dashboards, research, or models that address the question.
Validate outputs with users, document the process, establish ownership, and train the team.
Connected sources and reconciled definitions give you information you can rely on.
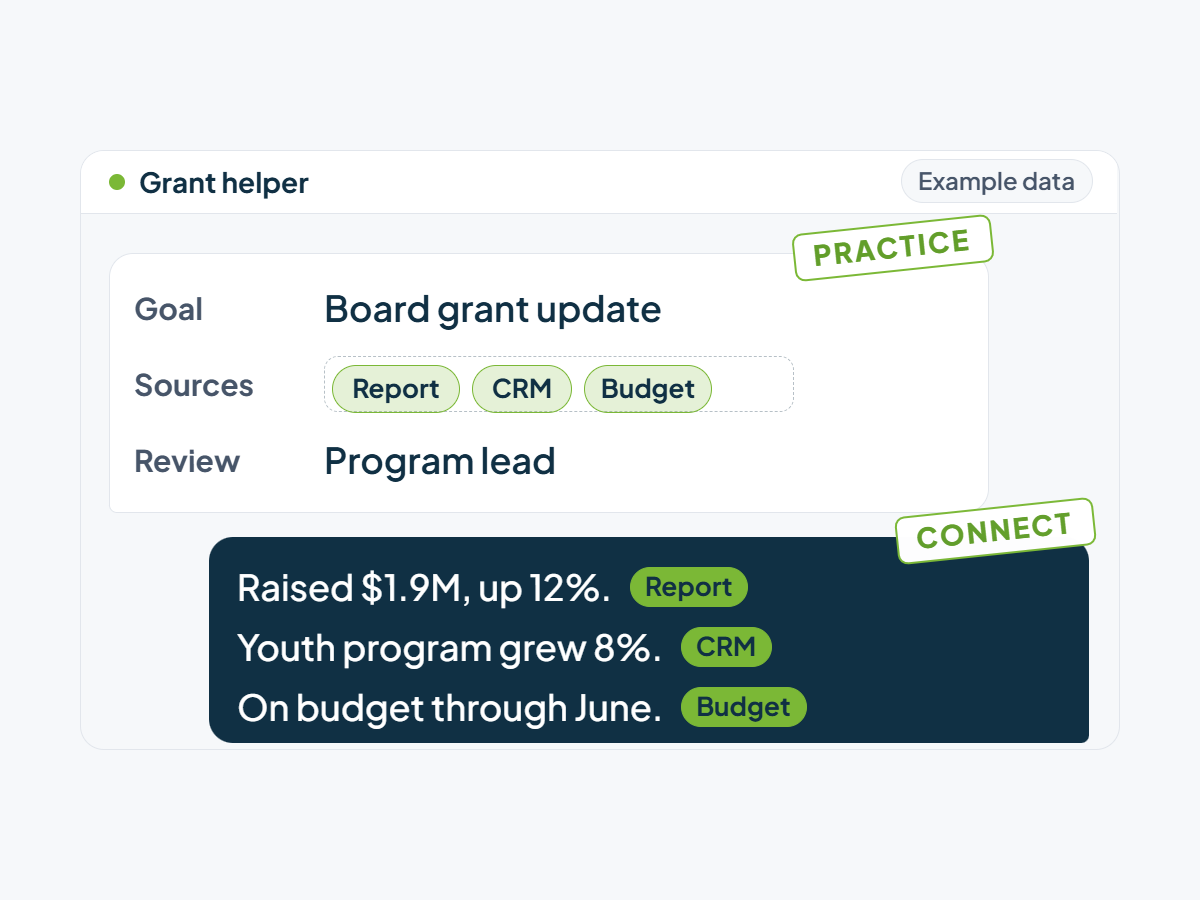
The right information reaches the systems, workflows, and reports your team already uses.
Research and analytics help your team decide with evidence, not guesses.
Critical reporting knowledge became a shared, validated process, followed by reporting support, data-platform development, and organizational transition work.
Read the story →No. We also work on source reconciliation, metric definitions, research, analytical models, reporting continuity, documentation, and training.
Yes. Finance data integration, reconciliation, reporting, and analytics are services in their own right. Weaver is an additional product for decision preparation and follow-through.
Yes. Customer and campaign data, segmentation, CRM-to-revenue reporting, and measurement questions can be part of the scope. We begin with the decisions and evidence available.

Tell us about the systems, reports, or workflow getting in your way.